
Gigawatts, terajoules, and petagrams. Climate science quantities are a dizzying list of terms that make it difficult to understand the amounts of greenhouse gases and energy requirements. This blog post will define some of those terms and put them into perspective using commonplace examples. It is essential to understand the terminology and quantities at play in climate change and to explain how emissions, energy, and power are measured.
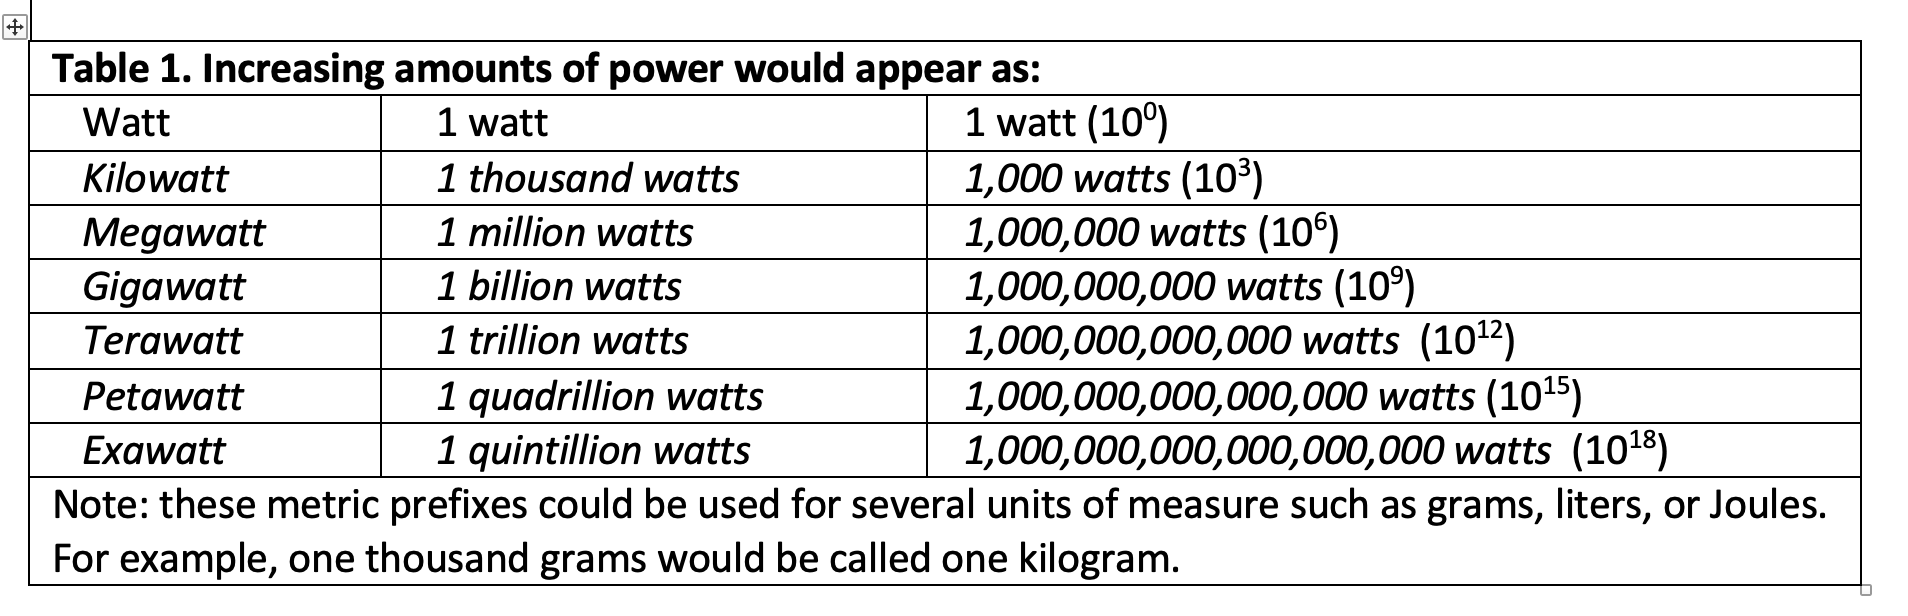
Table 1 lists the common prefixes of the metric system and their scientific notations. The prefixes – kilo, mega, and giga, for example, are shorthand for thousands, millions, and billions.
1. Weight of greenhouse gas (GHG) emissions
Let’s start with one of the most common measurements: weight. The amount of greenhouse gas emissions from coal, oil, and natural gas is normally measured in grams.
Most countries and organizations use the metric system and use the term grams. The U.S. uses a different system called the imperial system and our standard unit of weight is the pound. And, to make understanding these large quantities and terms even more difficult, the metric and imperial systems use different quantities but similar terms. The metric system uses “metric tonnes," and the imperial system uses “short tons.” A metric ton is 1,000 kilograms (about 2,205 pounds). A short ton is an imperial unit equal to 2,000 pounds (about 907.2 kilograms).
The smoke or smog that comes out of tailpipes or smokestacks is fine particulate matter, but those tiny particles have mass and weight. Since it is difficult to weigh large amounts of gas, emissions are estimated using a mathematical formula, one that combines the amount of (1) GHG-producing activity with an (2) emissions factor. The product of the two factors is the amount of GHG emissions produced. (Note 1)
Central to this calculation is the understanding that fuels produce different amounts of emissions. Coal, for example, is the dirtiest of the fossil fuels and natural gas is the least polluting. Petroleum is in the middle. It is technically correct to say that natural gas is the cleanest of the fossil fuels although natural gas is one of the biggest sources of GHGs.
As an example, the first factor (the activity) could be an action that uses 100 gallons of gasoline in a vehicle, 1,000 liters of heating oil for a building, 500 cubic feet of methane from a natural gas well, or 10 tons of coal for an electricity generation plant. Until recently, nearly every sector of our modern systems used fossil fuels and produced tons of GHG emissions (CO2, CH4, or N20). The second component, the emissions factor, is the average rate at which an activity releases a greenhouse gas. (2) For example, burning one gallon of gasoline emits approximately 8.88 kilograms of CO2, according to the Environmental Protection Agency (EPA). A cross-country commercial plane produces as many as one kiloton of GHG emissions. That's an average, of course. Emission amounts vary by efficiency of the car or plane, the quality of the fuel, the distance traveled, the speed, and several other factors. The rates are determined by scientific testing and established databases, normally by an organization such as the Environmental Protection Agency (EPA), the International Civil Aviation Organization (ICAO), or the International Maritime Organization (IMO). The result is the amount of the pollutant that is produced (measured in kilotons or gigatons).
Here's an example. A private jet that flies from New York (LGA) to Miami International Airport (MIA), a 2.5-hour trip of about 1,100 miles, uses about 2,000 gallons of aviation fuel. Because every liter of aviation fuel produces a specific amount of greenhouse gas, the carbon footprint of the flight generates about 8,600 kilograms of CO2. (3)
GHG emissions from everyday activities
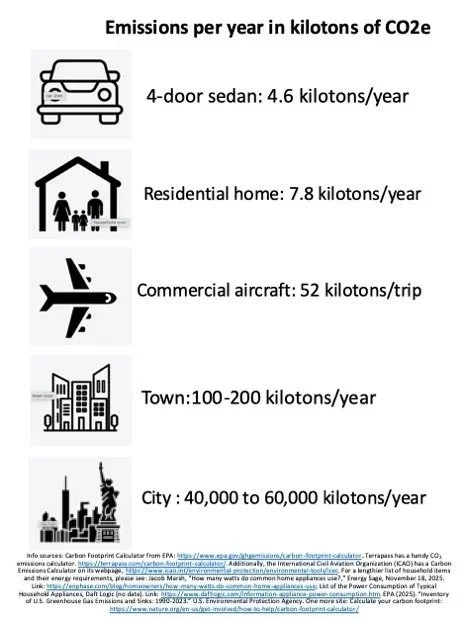
Let’s try putting these intangible quantities into context. A 4-door sedan in the United States produces about 4.6 metric tons of GHG emissions per year. In contrast, an average home in the United States produces about 7.5 metric tons of GHG emissions annually, according to the U.S. Environmental Protection Agency (EPA). Flying a 727 commercial aircraft for 6,000 kilometers (the distance from Washington, D.C. to Paris, France) will produce 52 metric tons of carbon dioxide. Operating a coal plant (the dirtiest type of fossil fuel) produces about 6.3 million metric tons of CO2 each year. In contrast, in 2024, all the decarbonization equipment (such as carbon capture and storage (CCS) or direct air capture (DAC)) was able to extract about two million metric tons of CO2. Operating 220 coal plants for one year produces one billion tons of emissions. One gigaton of CO2 is also the equivalent of the annual emissions of major developed countries such as Japan and Iran. (4)
Large-scale GHG emissions
Let’s think even bigger. In total – hold onto your seats – more than two trillion metric tons of carbon dioxide and methane have been released into the atmosphere since the industrial revolution began in the 18th century. (5) Annually, humans produce about 40 gigatons of CO2 per year into the atmosphere. Since there is a positive correlation between GHG emissions and global temperatures, this annual estimation of 40 GT of GHG emissions is a very important number when it comes to calculating the remaining carbon budget that the planet has before it crosses important thresholds such as 1.5 or 2.0 degrees Celsius (the increase in average global temperatures since the start of the Industrial Revolution). See more about the carbon budget in chapter 2 of my forthcoming book, Latin American Anthropocene.
2. Greenhouse gas concentrations
The amount of GHGs in the atmosphere is also represented by the concentration of a gas in parts per million (ppm) or parts per billion (ppb). One may wonder how a small exhaust cloud from an accelerating vehicle can create such havoc. But the magnitude of the problem becomes clear when one realizes there are more than 1.4 billion vehicles on the planet, not to mention the ships, aircraft, houses, buildings, factories, and power plants that are also pumping their exhaust into the air. (6)
For hundreds of millions of years, the amount of carbon dioxide fluctuated between 180 and 280 ppm. However, as humans continue to pump dangerous emissions into the atmosphere, the concentration levels are increasing. In June 2026, as I was writing this post, the CO2 levels reached 432 ppm, a 47 percent increase over pre-industrial periods. Methane and nitrous oxide concentrations have also risen sharply. The concentration levels of methane (CH4) have reached 1934 ppb (156 percent more than pre-industrial levels) and concentration levels of nitrous oxide (N2O) have reached 337 ppb (23 percent more than pre-industrial levels). (7)
NOTES:
(1) Want to see a sampling of the Carbon Dioxide Emissions Coefficients calculated by the U.S. Energy Information Administration? Visit the EIA webpage at: https://www.eia.gov/environment/emissions/co2_vol_mass.php .
(2) If it helps, think of it as the difference between how "dirty" different types of fossil fuels are. Some fossil fuels (e.g., anthracite coal) are much dirtier than others (finely reprocessed natural gas). Please don’t lose sight of the fact that both are types of fossil fuels.
(3) Terrapass has a handy CO2 emissions calculator. https://terrapass.com/carbon-footprint-calculator/ Additionally, the International Civil Aviation Organization (ICAO) has a Carbon Emissions Calculator on its webpage, https://www.icao.int/environmental-protection/environmental-tools/icec
(4) Quantities from this paragraph come from the following sources: Environmental Protection Agency (EPA), “Greenhouse Gas Emissions from a Typical Passenger Vehicle,” (no date). Link: https://www.epa.gov/greenvehicles/greenhouse-gas-emissions-typical-passenger-vehicle#burning; Benjamin Goldsteina, Dimitrios Gounaridisa, and Joshua P. Newella, “The carbon footprint of household energy use in the United States,” PNAS, vol. 117, no. 32, 11 August 2020; International Civil Aviation Organization (ICAO), Carbon Emissions Calculator, https://www.icao.int/environmental-protection/environmental-tools/icec; EPA, Greenhouse Gas Equivalencies Calculator. Link: https://www.epa.gov/energy/greenhouse-gas-equivalencies-calculator; Carl-Friedrich Schleussner et al., "Overconfidence in climate overshoot," Nature, vol 634, 10 Oct 2024); Tim Puko, “As disasters spike, superpowers face mounting calls to forge climate deal,” Washington Post, 25 Sept 2023.
(5) National Academies of Sciences, Engineering, and Medicine and Federal Judicial Center. 2025. Reference Manual on Scientific Evidence: Fourth Edition. Washington, DC: National Academies Press. https://doi.org/10.17226/26919. See page 1570.
(6) See EPA (2025). Inventory of U.S. Greenhouse Gas Emissions and Sinks: 1990-2023 U.S. Environmental Protection Agency. See also the Glossary from the IPCC 2023 Synthesis Report, Annex I.
(7) EPA (2025). “Inventory of U.S. Greenhouse Gas Emissions and Sinks: 1990-2023.” U.S. Environmental Protection Agency.